Posts

Top 10 bestseller books - Investing

Image
If you are looking for the best books on investing and finance, then look no further than the top 10 bestsellers on the market. There are so many titles available that it can be difficult to narrow your choice down to just 10, but these ten books have stood the test of time and have been consistently recommended by experts and investors alike. Click on the links to check out the books on Amazon! 1.  " rel="nofollow" style="text-align: center;" target="_blank">The Intelligent Investor   by Benjamin Graham. Widely regarded as the ultimate read for anyone interested in investing, this investing classic has sold millions of copies thanks to its timeless advice and timeless investment principles. 2.  " rel="nofollow" style="text-align: center;" target="_blank">Rich Dad Poor Dad   by Robert T. Kiyosaki. This must-read book encourages readers to increase their financial knowledge and teaches valuable lesso...

Federal Fund Rate - All about it and more

Image
The Federal Funds rate is the rate banks charge each other for overnight loans of reserves. Those reserves are held by banks at the Federal Reserve, and the rate is set by the Federal Reserve Open Market Committee (FOMC). While the Fed Funds rate is the main instrument for implementing monetary policy , it’s important to note that the federal funds rate isn’t the same as the discount rate. The discount rate is the rate the Fed charges banks for short-term loans, whereas the Federal Funds rate is a rate banks charge each other for reserves. The Federal Funds rate has an important role in setting monetary policy. The Federal Reserve sets a target for the Federal Funds rate, and other interest rates in the economy, such as mortgage rates and credit card rates, generally follow. The Fed Funds rate also influences long-term interest rates, such as 10-year Treasury notes. When the Fed lowers the Federal Funds rate, it usually leads to lower long-term rates, which ...

The Stock Market Game

Image
Ah, the stock market game . To some, it’s an exciting opportunity to try to turn a small investment into a much larger one, and to others it’s a source of stress and anxiety. But regardless of your opinion, there’s no denying that playing the stock market game can be a great way to learn about investing, finance, and the market. For those not familiar, the stock market game is basically a simulated stock market in which players invest virtual money in stocks, bonds, and other assets. Players receive a set amount of money to start and can select from a range of stocks. The goal is to make the most money over the course of a certain amount of time. The Origin The Stock Market Game was created by the Securities Industry Association (SIA) in 1977. It was created to assist educators in teaching students about personal finance and the stock market. The program was later acquired by SIFMA Foundation for Investor Education and is now known as " InvestWrite " IMVESTWRITE S...

Failure of the First Republic Bank

Image
The First Republic Bank was established in the early 1990s, Headquartered in San Francisco, California, but unfortunately, its life would be short-lived. By the mid-90s, the bank had already failed due to a number of issues. Primarily, the bank relied heavily on high-interest-rate loans, which meant that they were unable to tap into more profitable niches. As a result, the bank was unable to keep up with its growing debt and eventually had to be closed down. Another major factor in the failure of the First Republic Bank was its failure to diversify its loan offering s. Rather than catering to a variety of customers, the bank tended to focus on one particular type of loan - installment loans - and as a result, encountered difficulty when trying to attract new customers. Additionally, the bank did not keep up with modern banking techniques , such as moving money electronically in order to remain competitive. Ultimately, the technological inadequacies meant that the bank was...

The Silicon Valley Bridge Bank (SVB) Fiasco

Image
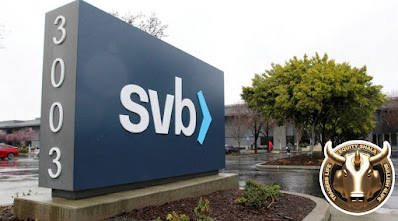
The Silicon Valley Bank (SVB) collapse is a devastating reminder of the potential consequences of mismanagement and fiscal irresponsibility, as well as a story of what could happen if financial organizations aren't as carefully managed as they should be. In 2016, SVB collapsed as a result of a $6.4 billion loan gone wrong and the failure of the institution's leadership to properly manage its investments and funds.  SVB, which had been in business for more than 20 years, was a “bridge bank” that specialized in providing capital to venture capital firms and high-tech start-ups. It was the largest bridge bank in the US at the time. But after a series of risky investments, many of them outside the bank's usual business practice, the bank hit serious trouble. Unfortunately, the SVB collapse showed that the company’s leadership had made some very bad decisions when it came to lending and investment practices. Over-leveraging was the primary cause of SVB's collapse, as the in...

The greatest scams in the US Stock Market

Image
In the United States stock market, there are some spectacular scams that have been perpetrated over the years. From Ponzi schemes to insider trading, these scams have cost investors billions of dollars and created an atmosphere of mistrust in the stock market. Here we will look at some of the greatest scams in US stock market history and how they were perpetrated. Bernie Madoff Scandal The most notorious of all US stock market scams is that of Bernie Madoff. Madoff was a broker who operated one of the most successful investment firms on Wall Street. Through a mixture of deception and fraudulent activities, Madoff was able to convince his investors that the returns they were receiving on their investments were legitimate. Although it was later discovered that much of the money being invested was simply being reinvested to create the illusion of higher returns, the scheme cost investors a whopping $17 billion. CEO stock options backdating scandal Another major stock market scam was the C...

The history of NASDAQ & Dow Jones

Image
The NASDAQ The NASDAQ (National Association of Securities Dealers Automated Quotations) is a stock exchange that was founded in 1971 to become the world's first electronic, screen-based stock market . The exchange model provided a revolutionary platform for the execution and settlement of stock transactions, representing a major step forward in the improvement of market liquidity, transparency, and market efficiency. Prior to 1971, stock traders relied on the “price-time” system, which meant that orders were executed based on a combination of price and order time. This system was inefficient and produced results that were often disadvantaged to one party or the other. The creation of the NASDAQ changed the game by introducing an automated system that allowed orders to be processed based on price only.  The launch of the NASDAQ was met with strong demand, and by the end of 1975, the exchange’s market capitalization had reached 3.2 billion dollars. The exchange launch also coincided...

Leading vs Lagging Indicators; What's the Difference?

Image
Leading vs Lagging Indicators;  What's the Difference? When it comes to predicting the future performance of stocks and investments, there are two primary types of indicators: leading and lagging. While they’re both important tools in an investor’s arsenal, there are some distinct differences between the two. Let’s take a closer look. Lagging indicators look to the past to provide information about current conditions. This type of indicator relies on historical data to explain what is happening in the present. Lagging indicators are the most widely used as they are considered to be more reliable than leading indicators. However, this type of indicator won’t help you decide what to do in the future, since it only looks backward. Examples of lagging indicators are: 1. Moving Average 2. Moving Average Convergence Divergence 3. Bollinger Bands How to use Lagging indicators in the most effective way: To effectively use lagging indicators, start by finding a reliable source ...

TECHNICAL ANALYSIS

Image
The Origin Technical analysis is a form of stock analysis that involves the study of historical stock performance. It uses instruments such as trend lines, support and resistance lines, moving averages, and oscillators to identify patterns in stock market performance. Technical analysis has been widely used since the late 19th century, when the Dow Jones Industrial Average was introduced. The first use of technical analysis can be traced back to the Dutch East India Company in the 1600s , when a trader named Jacob Van Neck used charts to analyze the upcoming prices of tulip bulbs. He used this strategy to stay ahead of the market and turn a profit. Since then, advances in technology, including the advent of the computer, has enabled traders to use more sophisticated analysis to make trading decisions. In the early 1900s, Charles Dow introduced the Dow Jones Industrial Average in order to provide a benchmark to track performance in the stock market. This allowed investors to identify ...

10 most popular indicators for technical analysis of charts

Image
Technical analysis of charts is the systematic study of price and volume activity in order to identify market trends and make investment decisions. Technical analysis can be used to predict future price movements and can be used to identify support and resistance levels. The following are 10 of the most popular indicators used in technical analysis of charts. 1) Moving averages Moving averages are a popular indicator used in technical analysis to identify trends and to predict future price movements. A moving average is simply a simple calculation of the average price of a security or an asset over a certain period of time. The most common moving average used in technical analysis is the 20-day moving average. 2) Bollinger Bands Bollinger Bands are a technical analysis tool used to identify potential market volatility. Bollinger Bands are created by plotting the range of a security's closing prices over a given period of time. The range of the security is split in two, with the lo...

The origin of Options Trading

Image
Options  are contracts that give the holder the right but not the obligation to buy or sell a particular asset at a predetermined price within a specified time frame. Options traders have the advantage of  leverage , as the investor does not need to pay the full amount for the asset until it is time for them to close out their position. This means that the trader can benefit from added returns from minor price changes in the asset while having limited risk.  Options trading has a long history that dates back hundreds of years. Although options trading today may look quite different from its humble beginnings, many of the same principles remain in place. Options trading can be traced back to ancient Greece . Writers such as Thales suggested the idea of using options to manage risk for agriculture harvests. In fact, the earliest documented option agreement was created by the Ancient Greeks in 500 B.C . Around the same time, traders in Ancient Rome began trading contracts t...

Futures and Options

Image
A futures and options market is the infrastructure that allows investors to buy, sell, or trade in contracts for a particular asset or commodity. This market has become increasingly important for businesses and investors alike, providing both an efficient way to hedge their risks and a method of efficiently investing capital. While the concepts can be complex, there are some basic principles at the core of futures and options trading.   Basic Understanding Options are contracts that give the holder the right but not the obligation to buy or sell a particular asset at a predetermined price within a specified time frame.  Futures , on the other hand, are contracts that obligate the parties involved to buy or sell a particular asset at a predetermined price within a specified time frame.  In either case, these contracts are created and managed in the exchange environment meaning that there is a stated date of expiry and the ability to cl...

The Hindenberg Report on Adani Group and it's effect on the Indian Stock Market

Image
The Adani Group , founded by Indian entrepreneur Gautam Adani, is one of the nation's largest businesses and a leader in major sectors such as energy, ports, mining, and edible oil. As such, it is one of the most highly valued firms in the Indian Stock Market. Recently, the German research agency Hindenburg Research issued a report about the firm, claiming that its stock has been dangerously inflated due to reporting discrepancies, accounting irregularities, and law-breaking. This has had a significant effect on the Indian Stock Market. The Hindenburg Report revolved around the Adani Group’s revenue and profit reports, particularly in regards to recent acquisitions. It claims that Adani underestimated the price of these acquisitions, thus creating an artificially inflated worth in the company and its stock price. This is a violation of the Indian stock market guidelines, which requires truth and transparency in financial documents. The report also highlighted several accounting ir...

Trading and Investing

Image
Trading and investing are often confused for each other, but they are two very different strategies. Trading involves buying and selling securities or other financial instruments in the short-term to make a quick profit. Investing, on the other hand, is a longer-term strategy and involves buying and holding assets such as stocks, bonds, and real estate in order to achieve long-term capital appreciation.  When it comes to risk and reward, trading carries more risk . The nature of trading is such that you are constantly buying and selling, which means the profits you make can quickly be reversed. Moreover, you must have a deep understanding of the markets and superb timing to make consistent profits from trading.  In contrast, investing is a less risky strategy because you are holding the asset for the long-term. While it is possible to lose money in the short term, investments are more likely to increase enough in value over a period of time to yield long-term gains. You do no...

Support and resistance in equity charts

Image
Support and resistance in equity charts are used to describe the overall trend of a stock or index. When a security is trading at a certain level, the price is said to be either at a “level of support” or at a “level of resistance”. Support and resistance levels are determined when the recent past trading activity has shown that the price tends to stop or reverse around those levels. Support is the level at which a security has difficulty falling below. When a security is trading near a level of support, it indicates that the stock is considered "undervalued". Buyers may enter the market in anticipation of a rise in the stock price, and sellers may be reluctant to move the stock lower. Support levels can provide traders with an opportunity to buy a security when it is trading at an attractive price.  Resistance is the level at which a stock has difficulty going above. When a security is trading near a resistance level, it indicates that the stock is considered “overvalued”...

The ESG Revolution

Image
The ESG Revolution The ESG revolution is rapidly taking hold in the world of finance. ESG stands for Environmental, Social, and Governance and is a crucial measure that investors are taking into account when considering investment options. ESG is now being used as a key metric for determining the investment potential of certain companies and industries. ESG investments focus on companies and industries that are doing their best to promote and execute positive environmental and social practices, as well as sound corporate governance. This means that companies considered for ESG investments must demonstrate good behavior in terms of protecting the environment, offering a fair and inclusive workplace, and having transparent business practices. Furthermore, ESG investing requires companies to have an overall positive impact on society. The shift toward ESG investing is being driven by a number of factors. Investors are increasingly taking into account a company’s ESG score when deciding w...